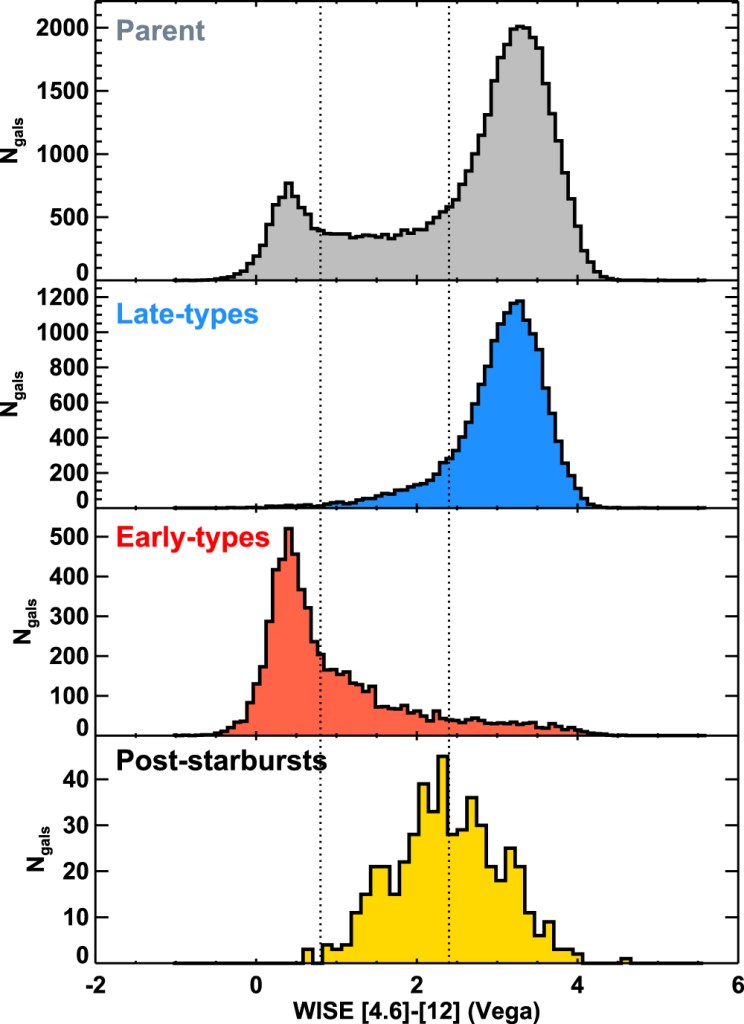
In my last post, I showed a diagram and mistankingly called it a CMD. It does have color on the x-axis, but the y-axis is the number of galaxies. So this is a histogram. Which makes doing this plot going to be a bit simpler than I thought. Making it pretty and readable is the hard part. So the color is from the Wide-field Infrared Survey Explorer (WISE: Wright et al. 2010).
So it turns out that the color data I grabbed was SDSS data, and not from WISE. I was a bit lazy so I decided to just make CMD instead with the MaNGA data and the SPOGS data. The plots actually turned out decently well.
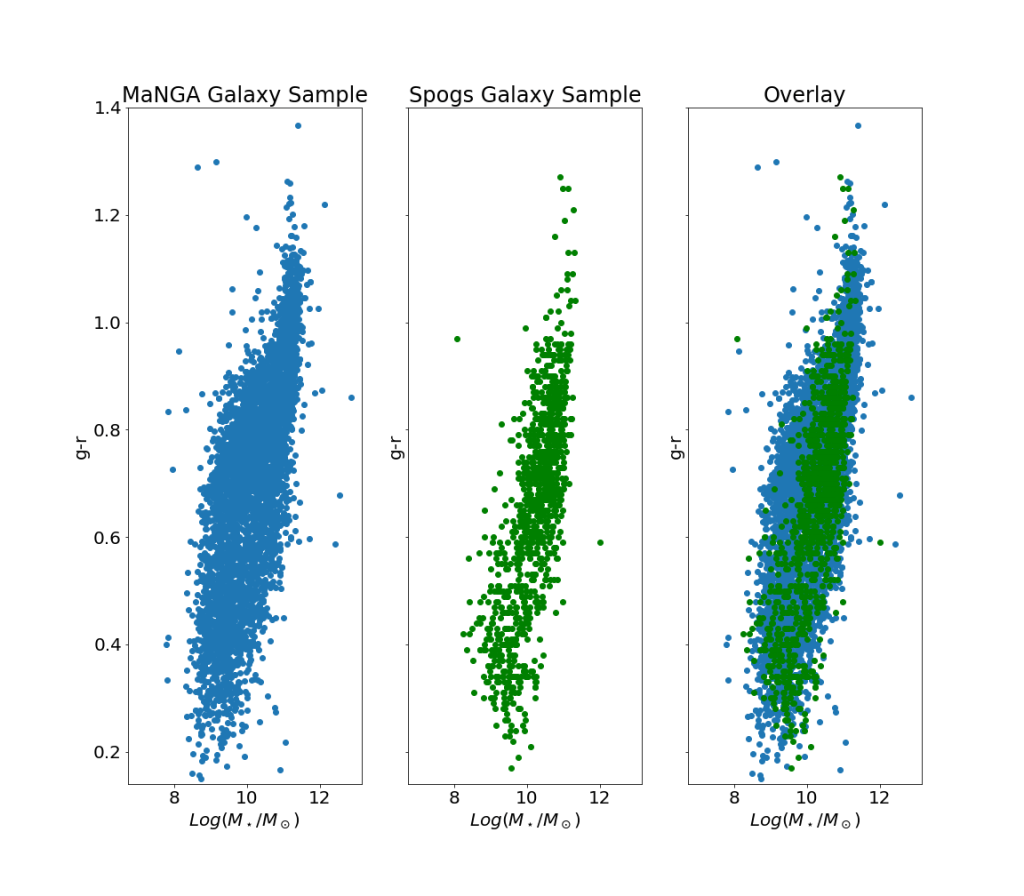
The plot above shows a relationship between a galaxies mass and it’s color. Another way of saying this is as galaxies become more massive, they appear more optically red. The above plot doesn’t do a good job of categorizing the galaxies. It turns out that if we plot the colors of galaxies and the number observed, a bimodality (2 separate groups) appears. The two groups of galaxies are Spirals and Ellipticals, and galaxies that are transitioning from one to the other are considered to be in the green valley.
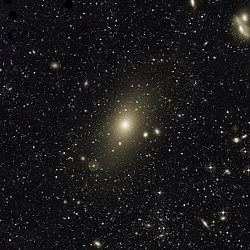
Elliptical Galaxy : Galaxy where black hole was imaged 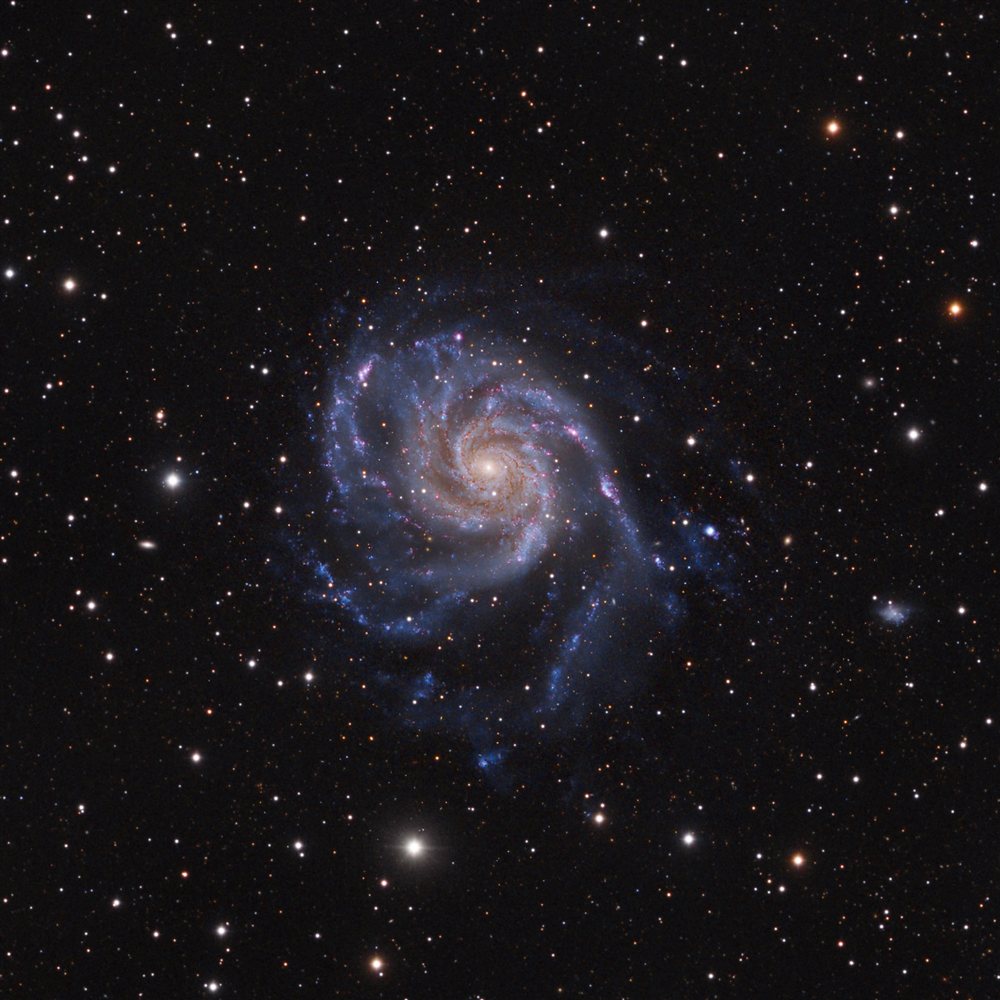
Spiral Galaxy : Very similar to Milky Way
First, I just want to point out how insane it is to be able to directly image a supermassive black hole in the center of that. You can’t even resolve each individual star. At least not without high precision instruments.
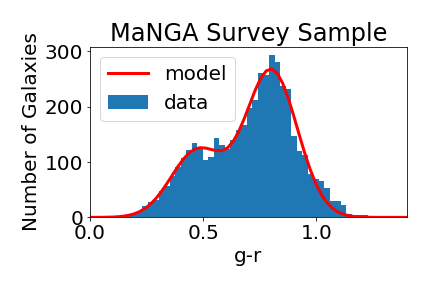
Anyway, so my idea was to create histograms for SPOGS and MaNGA. I was able to make histograms for both, with the MaNGA histogram showing two distinct groups. I decided to model this using two gaussians, which is kind of like an equation describing a probability. Each “peak” of the gaussian would be where the highest number of galaxies in each group is found. So I took the data, gave the computer some guess parameters, and got the best fit of the histogram, shown below.
Unfortunately, the fit failed when using the SPOGS data. It was annoying initially, but the SPOGS data is supposed to be candidates of Poststarburst galaxies, so it wouldn’t make sense for there to be two groups, since SPOGS is “supposed” to be transitional galaxies. Not bad for a first attempt, but I have an idea.
I want to cross reference the two sets of data; find which galaxies in SPOG were observed in MaNGA. I want to do this because MaNGA is an integral field survey. Instead of taking the light spectra at a singular spot on a galaxy, multiple plates “cover” each galaxy, and the spectra of the light from each plate is taken. This gives a more complete picture of what’s going on throughout the galaxy, which could be helpful in determining the properties of Poststarburst galaxies.
If anyone is interested in seeing the Juypter notebook where all the code is written:
